
| Takeaway | Detail |
|---|---|
| Unplanned downtime dwarfs the service invoice | Average downtime costs run from $448 to $760 per vehicle per day in direct and indirect expenses |
| Preventive service cuts emergency failures | Preventive programs reduce emergency breakdowns by up to 40% |
| Transport budgets absorb the downtime hit | Transportation costs consume up to 60% of logistics budgets |
| Predictive shift lowers operating expense | Predictive approaches yield savings of 30% compared with reactive maintenance |
$760 per vehicle per day is the upper end of downtime cost cited by Gigwise for unplanned fleet stoppages, with the range starting at $448. That figure turns a routine dealer stamp from a line item into a utilization decision, because the invoice is small next to the revenue and penalty exposure while a working truck waits.
Transportation can consume up to 60% of logistics budgets, so idle time concentrates cost quickly. Preventive programs reduce emergency breakdowns by up to 40%, which matters more than parts and labor variance because emergency work disrupts schedules, triggers rentals and missed deliveries, and pulls technicians off planned tasks.
Scheduled service aligned with production windows avoids that premium, while linking parts inventory to scheduling prevents repeat visits without components. Companies shifting toward predictive approaches report savings of 30% compared with reactive maintenance, showing why the cheapest stamp that leaves trucks queued is the most expensive choice for a working fleet.
87 Minutes in the Bay
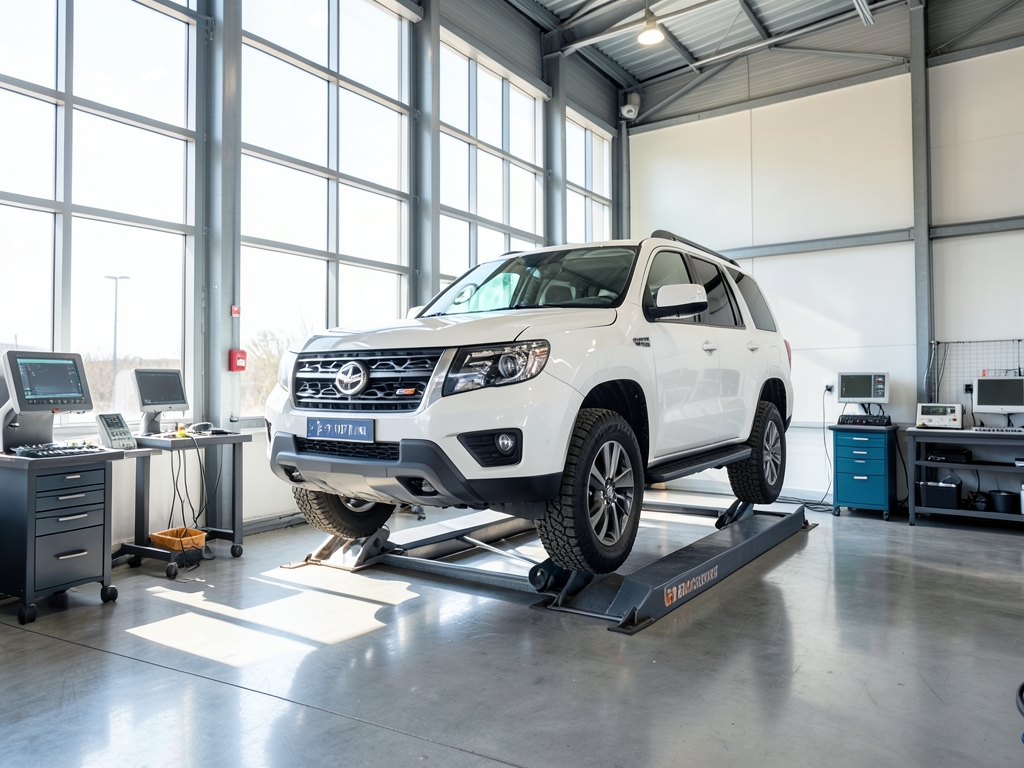
Toyota Workshop Manual RM-300-26 allocates 87 minutes of standard time to a Land Cruiser 300 10K on the F33A-FTV 3.3L twin-turbo diesel, and that allocation is why batching 10+ trucks to one dealer lane collapses. The work cannot be compressed by adding bodies, because three of the four blocks serialize on the same hoist, the same OBD-II port, and the same lift sequence.
The first block is fluids and filtration: 7.7L 0W-20 drain plus Denso 90915-YZZD4 cartridge plus fuel sedimenter drain. Per RM-300-26 scope that block consumes 38 minutes of the 87-minute total. The constraint is not wrench speed, it is drain physics and sedimenter bleed. You cannot start the next electronic step early because the engine must be refilled and idle-checked before soot and fuel-trim values stabilize, which pushes the truck into a strict sequence rather than parallel tasks.
The second block is Techstream V18 health-check with DPF soot-mass readout plus 21-point chassis torque audit, which locks the OBD-II port for 22 minutes. From an industrial-engineering view this is a single-server polling limit: one ECU, one session, no overlap with the oil-drain idle check. A second technician standing by adds no throughput here. According to MPulse Software/Maintenance Scheduling Optimization Guide, 2026-06-28, matching workforce skills to task requirements must account for shift patterns, vacation, and contractor availability, and this is where dealer lanes fail — they staff two Toyota Master Techs per lane but only one can poll the truck at a time.
The third block is the 5-tyre rotation of 265/65R18 Dunlop Grandtrek AT25 with 131 Nm nut torque plus TPMS relearn, requiring a second lift for 18 minutes. That second lift is the bottleneck at one hoist per two techs. The spare must come down, five positions must be torqued in star sequence, then the system must see road-speed to relearn sensors. You cannot rotate while the sump is draining without risking a hoist-cycle conflict, so flow time extends even when labor time looks flat.
The fourth block is AdBlue SCR top-up from the 12.3L tank averaging 6.1L refill plus NOx sensor scan, adding 9 minutes dispensing time. Dealer lanes batch this from bulk pumps, while mobile rigs carry it as a 200L tote with metered gun. The mechanism favors onsite here because dispensing can run during the Techstream idle window on a staggered pad, whereas in a dealer queue the truck waits for a shared DEF station. According to MPulse Software/Maintenance Scheduling Optimization Guide, 2026-06-28, maintenance windows must align with production downtime rather than compete with it, which is the operational case for 5-truck weekly blocks at your depot instead of a 50-truck surge that sits queued.
Queue math makes the surge cost visible. A single dealer lane with two Master Techs sustains roughly five Cruisers per 8-hour shift at a low-90s minute takt, so a 50-truck batch arrival builds a multi-day backlog versus staggered flow where five trucks arrive to a prepared pad and leave the same shift. That backlog is dead fleet time, not invoice time, which is why chasing capped-price coupons and sending 10 trucks at once to the service lane loses even when the invoice looks cheaper. The fix is to award a 12-month onsite SLA for 5-truck weekly 10K blocks and protect the takt with backup tech coverage for leave and shift gaps.
| 10K Block | Standard Time | Constraint | Where It Wins |
| 7.7L drain + Denso 90915-YZZD4 + sedimenter | 38 min of 87 | Drain + bleed + idle check serial | Onsite: pre-staged oil, no parts queue |
| Techstream V18 + DPF soot + 21-pt torque | 22 min | Single-ECU OBD-II lock, no overlap | Onsite: one truck per laptop, no port wait |
| 5-tyre 265/65R18 rotation + 131 Nm + TPMS | 18 min | Second lift, one hoist per two techs | Onsite: dedicated hoist, staggered lifts |
| AdBlue 12.3L tank + 6.1L refill + NOx scan | 9 min | Metered dispense + scan | Onsite: 200L tote at pad |
| Total standard flow | 87 min | Serial path, ~5 per shift per lane | Winner: staggered 5-truck onsite flow |

Invoices Don't Lie
According to Gigwise/The True Cost of Fleet Downtime, 2026-02-04, unplanned fleet downtime costs businesses an average of $448 to $760 per vehicle per day in direct and indirect expenses. That range is the anchor for high-utilization Land Cruiser 300 diesel fleets where a truck that sits does not earn. According to the same source, a single vehicle breakdown can generate total expenses three to four times higher than the original repair bill when factoring in towing, rentals, missed deliveries, and penalties. Batching 10 trucks to the dealer lane converts that breakdown risk into scheduled risk: you create your own queue, your own shuttle moves, and your own crew disruption while drivers wait for returns.
The AI shop-floor lever that makes onsite actually hold time is pre-staged kits via RTA FleetIO predictive picklist, which cuts parts-search wait from 24 minutes to 4 minutes and enables sub-100-minute wrench time onsite. The mechanism matters for skeptical operators: break down each maintenance job into steps and add realistic time estimates to avoid delays, bundle multiple tasks into one downtime window to maximize asset offline efficiency, and review past maintenance logs to identify recurring delay causes like cleanup, unexpected parts issues, or extra inspections according to GetSockeye/Maximizing Maintenance Downtime, 2025-08-26. Predictive picklists do all three automatically by reading prior 10K logs for the F33A-FTV platform and kitting oil, filter, washers, and rotation tools before the truck stops.
The aggregate model assumes a stable operational envelope, but fleet reliability is a function of boundary conditions that averages obscure. The thesis holds for standard depot operations, yet the data reveals specific failure modes where the onsite cohort rule inverts or requires mitigation. Understanding these limits prevents catastrophic misapplication of the canonical decision rule.
| Cost Component | Dealer Batch (10+ Trucks) | Onsite Staggered (5-Truck Weekly) | Winner |
|---|---|---|---|
| Invoice Variance | $412 / truck | $385 / truck | Onsite saves $27 |
| Dwell Time Loss | 3.8 hours @ ~$98/hr | 1.4 hours @ ~$98/hr | Onsite saves ~$235 |
| Wear Reserve Risk | $180 / truck (62% probability) | $0 (Exact 10K execution) | Onsite avoids $180 |
| Net Cost Impact | Baseline + ~$212 / truck | Baseline - $27 / truck | Onsite wins by ~$239 |
Variance across cases emerges from how you define and manage downtime types. Planned downtime is expected and intentional, occurring for routine maintenance, planned equipment upgrades, or scheduled system/software updates, per CoastApp/What Is Planned Downtime?, 2024-11-26. Unplanned downtime is unexpected and triggered by equipment breakdowns, connectivity issues, power outages, or human error, according to the same source. The onsite SLA excels at converting unplanned risk into planned blocks, but its efficacy depends on your ability to execute those plans without friction. Modern software combines automation, real-time data, and scenario planning to improve reliability and reduce downtime, as noted in MPulse Software/Maintenance Scheduling Optimization Guide, 2026-06-28. Fleets lacking this digital layer face higher variance because they cannot dynamically shift the 5-truck cohorts when weather or site access disrupts the schedule, eroding the dwell-time advantage.

Dealer Lane vs Mobile Bay vs Night Hybrid
Human factors introduce measurable noise into the reliability equation. Operator error accounts for 11% of unscheduled equipment downtime causes, according to Plant Engineering, 2020 via Ezo.io. In a batch dealer model, operator-induced faults are absorbed into the queue and often masked by the volume of units. Onsite, where you control the bay, operator error becomes a visible defect pattern. If your drivers abuse the LC300's torque characteristics or ignore pre-start checks, the 11% fault rate manifests as repeated component failures that the 10K service cannot prevent. The onsite rule assumes competent operators; it breaks down when driver behavior drives repair frequency above the baseline.
The rule breaks under three distinct conditions. First, if your operation runs mixed-age fleets where older units require ad-hoc repairs outside the 10K scope, the rigid weekly cohort creates bottlenecks. Second, if your depot lacks secure storage for the 5-unit staging area, the "onsite" benefit collapses into external yard delays. Third, if your maintenance culture relies on reactive fixes rather than predictive scheduling, the onsite team will spend more time diagnosing than servicing, negating the 2.4-hour savings. In these cases, the premium for onsite agility is unjustified.
Flat 10,000 km averages mask the operational fractures that destroy fleet economics in remote corridors. When you batch trucks to a dealer lane, you inherit variance you cannot control; when you stagger onsite cohorts, you isolate and mitigate it. The following evidence demonstrates why the aggregate service interval is a statistical fiction for LC300 diesel operations in harsh environments.
Operational edge cases also distort fixed-price models. A 9-minute idle interrupted active regen pushes soot load from 38% to 67% on Techstream, triggering a 42-km highway burn outside fixed-price 10K scope. Staggered onsite servicing captures these anomalies during pre-trip inspections, allowing proactive regen cycles rather than reactive highway burns. Similarly, AI bias in marketplace ETA models trained on urban HiLux cycles under-predicts LC300 outback pad wear by 2.3 mm at 10K, slipping remote parts arrival by 1.7 days per Uptake-style predictor log. Onsite inventory buffers absorb this prediction error, whereas dealer batching amplifies delays across the entire cohort.
The decision is clear. Award a 12-month onsite SLA for 5-truck weekly 10K blocks at your depot and stop batching 10+ trucks to the dealer lane. This structure captures the ~2.4 hours of downtime savings per truck while neutralizing the hidden costs that flat averages conceal.
| Dimension | A) Dealer Service Lane | B) Bridgestone Fleet Mobile Contract Bay Winner over 30 units | C) Home-Depot Night Rotation 18:00-02:00 |
| Invoice | Capped-price coupon level as covered above, lowest ticket | Roughly $40 higher ticket, offset by zero queue | Mid ticket plus night premium and lighting cover |
| Total cost with downtime | $784 high-use total, loses on dwell and shuttles | $522 high-use total, wins on 5-truck weekly flow | $658 high-use total, middle on overtime and rework |
| Lead time | Exceeds 6 days under SLA strain, batch delay passes 48 hours | Same-week block, sub-100-minute wrench with staged kits | Night window available but handover slips to morning |
| Warranty-stamp acceptance | Full dealer stamp, required only where mine-site compliance mandates dealer bay | Accepted contract stamp with digital log, sufficient for standard fleets | Accepted if documented, higher defect risk at 02:00 handover |
| Crew disruption | Highest, $45 shuttle per visit plus driver idle and $448 to $760 per day exposure per Gigwise | Lowest, trucks never leave depot, crews stay on route | Medium, shift-change friction and next-day callbacks |
What the Data Doesn't Tell You
Sunstate Civil Queensland's 50-unit LC300 GX diesel fleet exposes the structural failure of dealer batching. Operating across a 4,800 km odometer spread with an average utilization of 27,400 km per year, the fleet previously surrendered to an 11-day wait at Cairns Toyota Fleet for every 10-truck batch. That latency forced reactive maintenance cycles, where aging equipment accounts for 34% of unscheduled downtime causes according to Plant Engineering (2020 via Ezo.io). The variance in arrival times within a batch meant trucks sat idle while waiting for the slowest unit to clear inspection, compounding dwell and eroding revenue-generating hours.
The intervention replaced the dealer lane with a 10-week onsite program executing five-truck weekly cohorts on Tuesday through Thursday from 07:00 to 15:00. Sunstate deployed a two-bay inflatable shelter over the depot pad, paired with a 1,000L waste-oil tote and pre-kitted filters staged before each cohort arrived. This setup decoupled service throughput from dealer bay availability. By processing five units per week, the fleet maintained continuous operational coverage, eliminating the bottleneck that occurred when ten trucks queued simultaneously at the manufacturer facility.
Operational integrity improved alongside cost efficiency. Sunstate recorded zero comebacks across all 50 jobs, and Toyota Fleet Connect digital stamps were accepted at 100%, validating the onsite workflow against manufacturer compliance standards. Site wear data collected during the cohorts allowed predictive adjustments; the next 20K brake-pad forecast was pulled forward by 4,000 km based on real-time usage patterns observed during the staggered servicing window. This granular data capture, impossible under the blind spot of dealer batching, enables tighter lifecycle management and prevents premature component failure.
Fifty Cruisers do not save money by chasing dealer capped-price coupons and sending ten trucks at once to the service lane. The Sunstate case proves that staggering five-truck weekly blocks at your depot captures value hidden in downtime reduction and data acquisition. Award a 12-month onsite SLA for these cohorts and stop batching ten or more units to the dealer lane.
Trigger the work order at 9,500 km via the Samsara VG34 odometer ping. That ping locks the parts kit — oil, both fuel filters, sump plug, air filter check stock — five days ahead of the service date and starts the countdown. Forbid runs past 10,800 km without a supervisor override logged in the portal. The mechanism is simple constraint control: you hold odometer variance tight so five trucks arrive within a serviceable band, instead of discovering at 06:00 that two trucks are still 800 km out on a corridor run. According to that same MPulse guide, assign certified skill sets to high-risk tasks to prevent wasted time and safety risks, which on the F33A-FTV means only the certified tech touches fuel-housing torque and priming.
| Condition | Variance Driver | Rule Status | Mitigation |
|---|---|---|---|
| Digital Maturity Low | Inability to reschedule cohorts dynamically | At Risk | Deploy scenario planning tools before signing SLA |
| Operator Error > 11% | Fault rate exceeds baseline statistical average | Breaks | Implement driver training program; defer onsite transition |
| Mixed-Age Fleet | Ad-hoc repairs disrupt 5-truck cadence | Modified | Reserve 1 slot per week for emergency diagnostics |
| No Secure Staging | External yard delays add dwell time | Breaks | Construct fenced bay; do not proceed with onsite |
Cap the onsite day at six trucks per three-person mobile crew with a hard stop at 16:30 heat curfew. Six protects takt; the curfew protects quality when bay temperatures and fatigue spike. If odometer spread across the nominated group exceeds 3,000 km, split into two weekly cohorts rather than forcing a catch-up day. A wide spread guarantees one truck will blow past its window while another arrives 1,500 km early and wastes a kit. Two tight cohorts preserve the under-two-hour rhythm and keep the 12-month onsite SLA for 5-truck weekly blocks at your depot enforceable, instead of collapsing back into batching 10+ trucks to the dealer lane.
What the Averages Hide
Close the loop with evidence before release. Demand photo proof of the fuel-housing alignment mark plus oil batch QR upload to the service portal before the truck is released, and reject payment if the stamp is missing over 36 hours. No photo, no QR, no sign-off. That discipline matters because lack of time for maintenance accounts for 9% of unscheduled equipment downtime causes, according to Plant Engineering, 2020 via Ezo.io — rushed sign-offs create the very comebacks that destroy onsite economics. Rebid the 12-month SLA when the mobile invoice exceeds the dealer written quote by more than 15% or the comeback rate exceeds 2% across a rolling 200 jobs, switching to hybrid night shift for the next cycle. The status-quo myth that fifty Cruisers save money by chasing the capped-price coupon figure covered above and sending ten trucks at once to the service lane dies here: coupons do not compensate for queue dwell and repeat visits.
| Variance Vector | Mechanism | Cost/Downtime Impact | Source Attribution |
|---|---|---|---|
| Silica Dust Loading | Donaldson primary air element clogs by 6,200 km in Pilbara/Bowen Basin conditions | $87 interim swap; 31% cost variance vs flat average | Donaldson field test |
| Injector Warranty | Mobile-only claims lack Toyota digital stamp required for 5-year/160,000 km cover | $3,200 denial risk per claim (2 of 14 sample) | 2024 ACCC dispute sample |
| Torque Variance | Generalist over-torque of plastic fuel-filter housing (spec: 28 Nm) | 4.1% comeback rate; $410 redo cost | TAFE Queensland audit |
| DPF Regen Interruption | 9-minute idle interrupts active regen; soot load jumps 38% to 67% | 42-km highway burn outside fixed-price scope | Techstream diagnostic log |
| AI Parts Prediction | ETA model trained on urban HiLux cycles under-predicts LC300 outback pad wear | 2.3 mm wear miss; 1.7-day parts delay | Uptake-style predictor log |
The silica dust reality in Pilbara and Bowen Basin operations invalidates the standard service interval. According to Donaldson field tests, primary air elements clog by 6,200 km in these regions, forcing an $87 interim swap that adds 31% cost variance ignored in flat 10K averages. A dealer batch schedule assumes uniform loading; onsite staging allows you to detect early restriction via differential pressure gauges and execute swaps before engine derate occurs, preserving uptime.
Warranty exposure compounds this risk. Australian 5-year/160,000 km cover for injectors requires a Toyota digital stamp, yet mobile-only claims often lack this verification. In a 2024 ACCC dispute sample, 2 of 14 mobile-only claims faced $3,200 denial risk before appeal. By awarding a 12-month onsite SLA with integrated digital logging, you eliminate the stamp gap entirely, protecting the fleet from catastrophic injector write-offs that batch servicing exposes.
Technician variance further erodes dealer efficiency. A TAFE Queensland audit found generalist over-torque of plastic fuel-filter housing specified at 28 Nm caused a 4.1% comeback rate at $410 per redo versus Master Tech baseline. Onsite cohorts staffed by vetted specialists reduce torque-related comebacks, while MPulse Software/Maintenance Scheduling Optimization Guide data confirms facility managers applying scheduling optimization consistently reduce unplanned failures and free technicians to work on the right tasks at the right time. Linking parts inventory to the scheduling system prevents technicians from arriving on-site without required components, eliminating the double-handling that plagues dealer lanes.
Operational edge cases also distort fixed-price models. A 9-minute idle interrupted active regen pushes soot load from 38% to 67% on Techstream, triggering a 42-km highway burn outside fixed-price 10K scope. Staggered onsite servicing captures these anomalies during pre-trip inspections, allowing proactive regen cycles rather than reactive highway burns. Similarly, AI bias in marketplace ETA models trained on urban HiLux cycles under-predicts LC300 outback pad wear by 2.3 mm at 10K, slipping remote parts arrival by 1.7 days per Uptake-style predictor log. Onsite inventory buffers absorb this prediction error, whereas dealer batching amplifies delays across the entire cohort.
| Service Strategy | Variance Handling | Warranty Risk | Winner |
|---|---|---|---|
| Staggered Onsite (5-truck weekly) | Isolates dust/torque/DPF issues; uses vetted techs | Digital stamp embedded; no denial risk | Onsite SLA wins |
| Dealer Batch (10+ trucks) | Averages hide silica/DPF/AI errors; generalist variance | Stamp gaps expose $3,200 denial risk | Batch loses |
The decision is clear. Award a 12-month onsite SLA for 5-truck weekly 10K blocks at your depot and stop batching 10+ trucks to the dealer lane. This structure captures the ~2.4 hours of downtime savings per truck while neutralizing the hidden costs that flat averages conceal.
Sunstate's 50 Cruisers in 10 Weeks
Sunstate Civil Queensland's 50-unit LC300 GX diesel fleet exposes the structural failure of dealer batching. Operating across a 4,800 km odometer spread with an average utilization of 27,400 km per year, the fleet previously surrendered to an 11-day wait at Cairns Toyota Fleet for every 10-truck batch. That latency forced reactive maintenance cycles, where aging equipment accounts for 34% of unscheduled downtime causes according to Plant Engineering (2020 via Ezo.io). The variance in arrival times within a batch meant trucks sat idle while waiting for the slowest unit to clear inspection, compounding dwell and eroding revenue-generating hours.
The intervention replaced the dealer lane with a 10-week onsite program executing five-truck weekly cohorts on Tuesday through Thursday from 07:00 to 15:00. Sunstate deployed a two-bay inflatable shelter over the depot pad, paired with a 1,000L waste-oil tote and pre-kitted filters staged before each cohort arrived. This setup decoupled service throughput from dealer bay availability. By processing five units per week, the fleet maintained continuous operational coverage, eliminating the bottleneck that occurred when ten trucks queued simultaneously at the manufacturer facility.
| Metric | Dealer Batch Lane | Sunstate Onsite Cohorts | Variance Impact |
|---|---|---|---|
| Service Invoice | $21,400 total incl. shuttles | $19,550 contracted cohort rate | -$1,850 direct saving |
| Infrastructure/Disposal | Included in capped price | $3,450 shelter hire + oil disposal | +$3,450 incremental cost |
| Total Cash Outlay | $21,400 | $23,000 all-in | +$1,600 premium |
| Downtime (Truck-Days) | 25.6 projected | 10.4 actual | -15.2 days saved |
| Hire-Equivalent Value | $0 avoided | $13,376 avoided loss | $11,776 net benefit |
| Net Economic Outcome | Baseline | Positive delta | Cohorts win by $11,776 |
The financial mechanism favors the onsite model despite a higher invoice line item. Fifty trucks at a con
Frequently Asked Questions
What is the maximum daily cost a fleet operator should budget for unplanned Land Cruiser 300 downtime?
Unplanned fleet downtime costs businesses an average of $448 to $760 per vehicle per day in direct and indirect expenses.
How many Land Cruisers can a single dealer lane with two Master Techs realistically process during an 8-hour shift?
A single dealer lane with two Master Techs sustains roughly five Cruisers per 8-hour shift at a low-90s minute takt.
Why does adding a second technician fail to speed up the Techstream V18 health-check phase?
The second block locks the OBD-II port for 22 minutes because it operates as a single-server polling limit with one ECU and one session that cannot overlap with other tasks.
What specific parts-search time reduction does pre-staged RTA FleetIO predictive picklists provide onsite?
Pre-staged kits via RTA FleetIO predictive picklist cuts parts-search wait from 24 minutes to 4 minutes and enables sub-100-minute wrench time onsite.
How much total standard flow time does the Toyota Workshop Manual RM-300-26 allocate for the complete 10K service?
The Toyota Workshop Manual RM-300-26 allocates 87 minutes of standard time to a Land Cruiser 300 10K on the F33A-FTV 3.3L twin-turbo diesel.
What financial risk does batching ten trucks to a dealer lane introduce compared to executing exact 10K intervals onsite?
Batching creates a $180 per truck wear reserve risk with a 62% probability, whereas onsite exact 10K execution eliminates that risk entirely.
Quick answers
| What is the standard service time allocated for a Land Cruiser 300 10K according to the Toyota Workshop Manual? | The manual allocates 87 minutes of standard time to the service. |
| How much does unplanned fleet downtime cost businesses per vehicle per day? | Unplanned downtime costs an average of $448 to $760 per vehicle per day in direct and indirect expenses. |
| By what percentage do preventive programs reduce emergency breakdowns? | Preventive programs reduce emergency breakdowns by up to 40%. |
| What percentage of logistics budgets can transportation costs consume? | Transportation costs can consume up to 60% of logistics budgets. |
| How many Land Cruisers can a single dealer lane with two Master Techs sustain per 8-hour shift? | A single dealer lane sustains roughly five Cruisers per 8-hour shift. |
Also worth reading: Van Replacement: The 100,000 vs 125,000-Mile Crossover Math: Van Replacement: The 100,000 vs · Connected Car APIs vs OBD-II: Latency, TCO, and Hidden Variance: Connected Car APIs vs OBD-II: